Example O2: Including data plots in rendered images
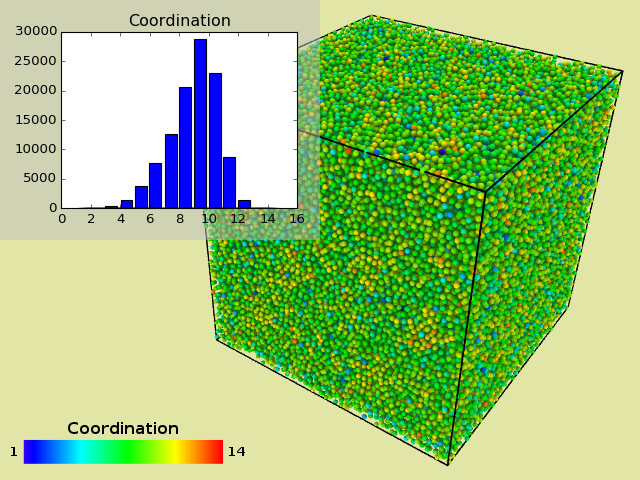
This user-defined viewport overlay function demonstrates how to use the Matplotlib Python module to render the radial
distribution function, which is dynamically computed by a CoordinationAnalysisModifier
in the data pipeline, on top the three-dimensional visualization.
import matplotlib
matplotlib.use('Agg') # Activate 'agg' backend for off-screen plotting.
import matplotlib.pyplot as plt
import PySide2.QtGui

def render(args):
    # Request the results of the pipeline at the animation time currently being rendered:
    data = args.scene.selected_pipeline.compute(args.frame)
    # Look up the DataTable generated by the CoordinationAnalysisModifier:
    if 'coordination-rdf' not in data.tables:
        raise RuntimeError('No RDF data found')
    rdf_data = data.tables['coordination-rdf'].xy()

    #  Compute plot size in inches (DPI determines label size)
    dpi = 80
    plot_width = 0.5 * args.size[0] / dpi
    plot_height = 0.5 * args.size[1] / dpi

    # Create matplotlib figure:
    fig, ax = plt.subplots(figsize=(plot_width,plot_height), dpi=dpi)
    fig.patch.set_alpha(0.5)
    plt.title('Coordination')

    # Plot RDF histogram data
    ax.bar(rdf_data[:,0], rdf_data[:,1])
    plt.tight_layout()

    # Render figure to an in-memory buffer.
    buf = fig.canvas.print_to_buffer()
    plt.close(fig)

    # Create a QImage from the memory buffer
    res_x, res_y = buf[1]
    img = PySide2.QtGui.QImage(buf[0], res_x, res_y, PySide2.QtGui.QImage.Format_RGBA8888)

    # Paint QImage onto viewport canvas
    args.painter.drawImage(0, 0, img)