Color legend viewport layer

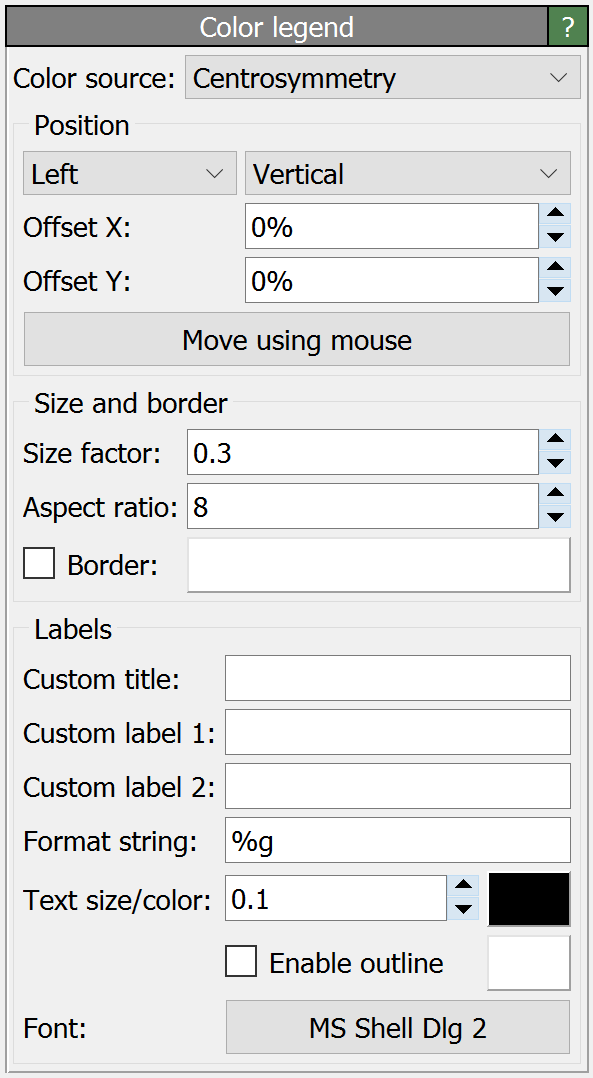
This viewport layer renders the color scale for a
Color coding modifier in the current pipeline
or the list of discrete element types and corresponding colors into the output picture.
The color legend helps observers to associate object colors in the picture with corresponding numeric values or element types.
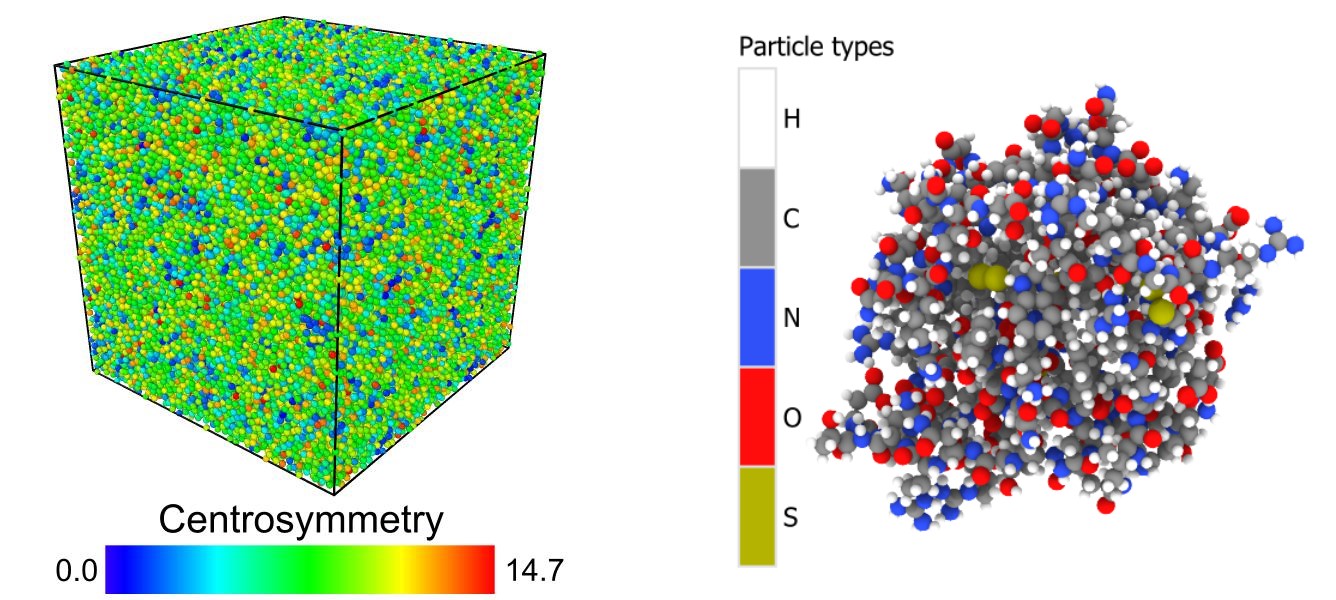
The following figure shows two typical examples for color legends: A color map for a continuous particle property
and a discrete color legend for the Particle Type property:

Color source
The Color source selection box at the top of the panel lets you choose where the legend should take its colors from. In the current program version, two types of sources are supported:
- Color coding modifier
The legend can display the color gradient and the interval range of a Color coding modifier that is part of the current data pipeline.
- Typed properties
Alternatively, the legend can display the set of discrete element types defined for a property in the output of the current data pipeline. Typical examples are the particle properties
Particle Type,Structure TypeorResidue Type. The legend displays the name and the associated color of each type defined by the selected source property. Note that the color legend layer itself is not responsible for coloring the particles or bonds. It may be necessary to insert a Color by type modifier into the pipeline.
Parameters
The other parameters of the color legend layer let you control the size, positioning and appearance of the color legend in the rendered picture. By default, the legend will be labeled with the name of the source property and, if based on a Color coding modifier, the numeric interval range set for that modifier. You can override the text of these labels by entering something into the input fields Custom title and Custom label.
If the legend is for a Color coding modifier,
the number formatting of the min/max values is controlled by a format specification string.
You have the choice between decimal notation (%f), exponential notation (%e) and an automatic mode (%g), which picks the best representation depending on the value.
Furthermore, the format string gives you explicit control over the output precision, i.e. the number of digits that
appear after the decimal point. Use %.2f, for example, to always show two digits after the decimal point.
The format string must follow the rules of the standard printf() C function.
Additionally, it is possible to append a physical unit to the format string, e.g. %g eV, if desired.
See also
ovito.vis.ColorLegendOverlay (Python API)