Voxel grid
This type of visual element controls the visual appearance of voxel grid data objects, which are structured grids made of 2- or 3-dimensional cells (voxels), each associated with one or more numeric values.
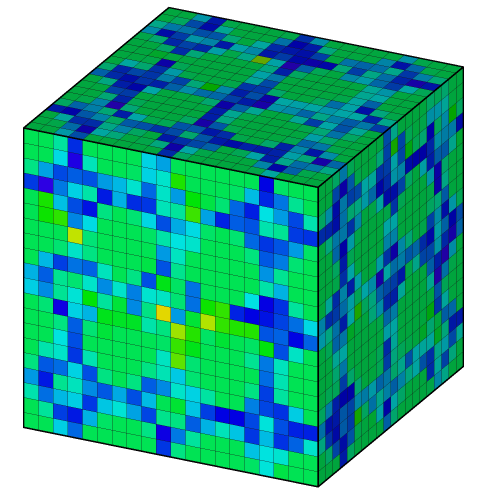
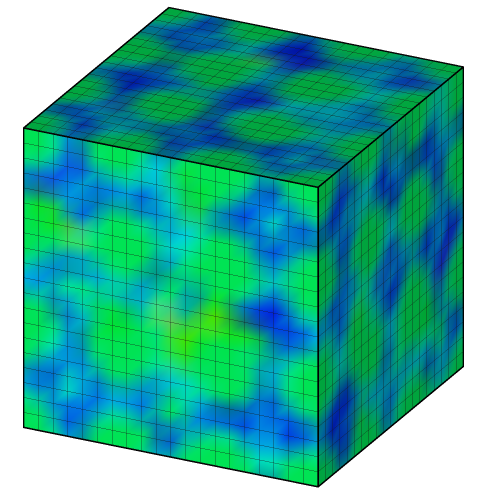
This visual element renders the voxel grid as a solid object showing just the voxel cells on the outer boundaries of the domain. Note that by default the voxel cells will all appear gray, because they do not have a color assigned to them yet. You can use the Color coding modifier to given them a color and visualize a numeric field quantity associated with the grid cells as in this example.
Parameters
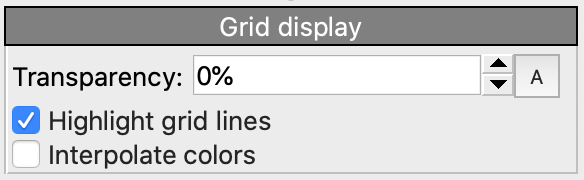
- Transparency
The degree of semi-transparency to use when rendering the grid surfaces.
- Highlight edges
Activates the rendering of wireframe lines along the edges of the grid cells.
- Interpolate colors
Will smoothly interpolate between the discrete colors of adjacent cells.
See also
ovito.vis.VoxelGridVis (Python API)