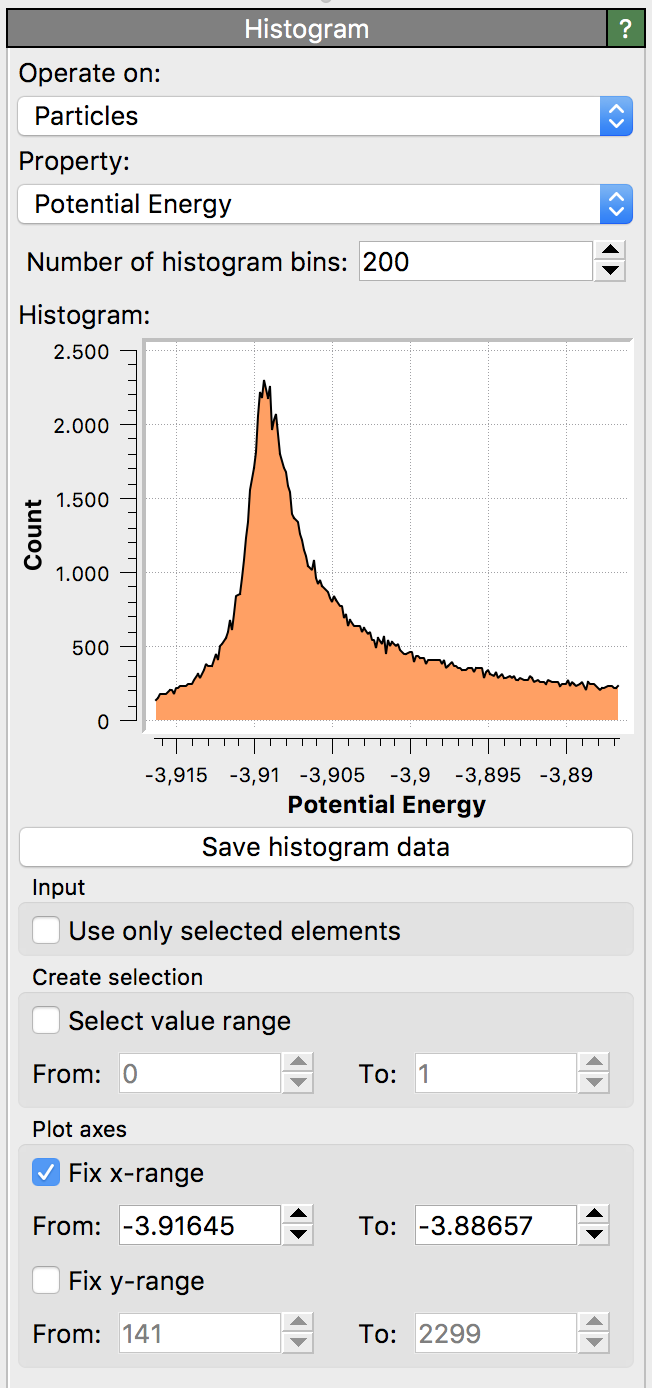
Histogram

This modifier computes the histogram of the values of a certain property, taken over all particles, bonds or other data elements in the dataset. The modifier furthermore lets you select all data elements that fall within a specified value interval.
Parameters
- Operate on
Selects the class of data elements the modifier should operate on (e.g. particles, bonds, etc). The drop-down list will only let you select classes that are present in the modifier’s pipeline input.
- Property
The source property for the histogram.
- Number of histogram bins
Controls the resolution of the computed histogram.
- Use only selected elements
Restricts the histogram calculation to the subset of particles or bonds that are currently selected.
- Select value range
This option lets the modifier perform a selection of all data element whose property values fall into the specified range.
- Plot axes
These modifier parameters control the histogram plot shown in the panel and let you zoom into a sub-region.
Time-averaged histogram
Note that the Histogram modifier calculates the histogram for the current simulation frame only and outputs it as a data table that may vary with simulation time. Subsequently, you can use the Time averaging modifier of OVITO to reduce all per-frame histograms to one mean histogram, which represents the average over all frames of the simulation trajectory.
See also
ovito.modifiers.HistogramModifier (Python API)